Overview
In early 2016, a small team of engineers at Narrative Science launched Narratives for Qlik, a third-party extension for Qlik Sense which automatically generated shareable, dynamic insights about charts and data in plain english. This small idea exploded in popularity, and soon thousands of users were generating and sharing narratives within their organizations.
I was brought on board shortly after launch to not only improve the existing UI, but to help expand this success to other business intelligence (BI) tools. By closely examining and iterating on feedback, we were able to increase user engagement with core features by 127%. Over time, this allowed us to expand the product’s overall capabilities in ways which addressed the needs of our expanding user base.
Case study
Understanding
While not much was known about our initial users, the original engineering team had implemented event tracking using Mixpanel which logged most user interactions. They had also built a basic feedback system which allowed users to reach out with questions and feature requests.
By looking first at direct feedback, we learned the most common complaint about the current functionality revolved around language quality and depth. In short - users thought our insights sounded clunky.
Most clunky language could be solved by tweaking a few configuration items which were already available to the user. However, by examining the Mixpanel data, we discovered that most users never took advantage of these settings, and those who did seemed to only adjust a small subset.
By performing an internal UX audit the issue became apparent: our narrative settings were not only difficult to find, but highly confusing. Anyone unfamiliar with the extension could not articulate how adjusting the majority of our settings would affect the insights.
Ideation
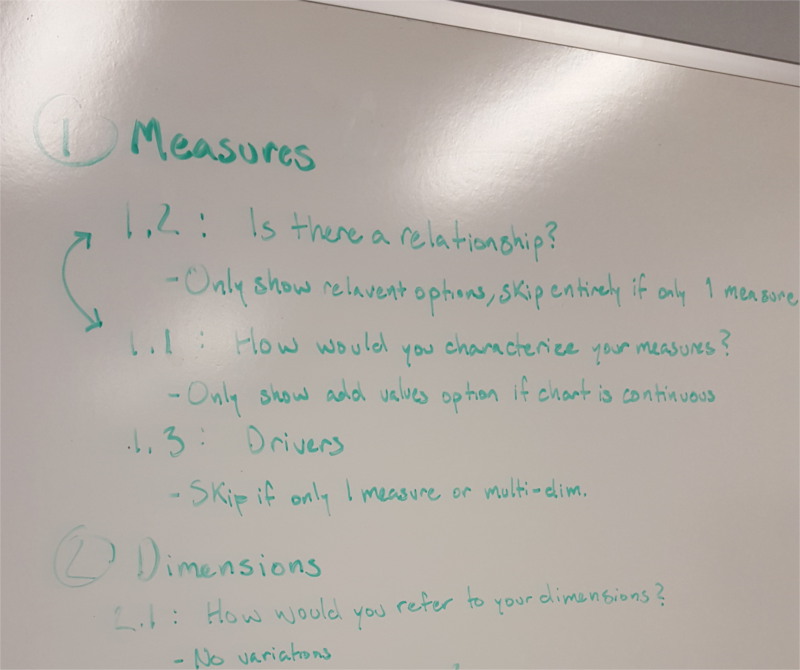
I began by mapping out all configuration items and collaborating with engineers to understand how they each work together. Often, adjusting one piece of configuration would affect the ability to change others. Using this information I was able to map a layout of independent pieces and indicate the order in which they were required to be set. I eventually landed on three sequential categories of configuration.
Wireframes
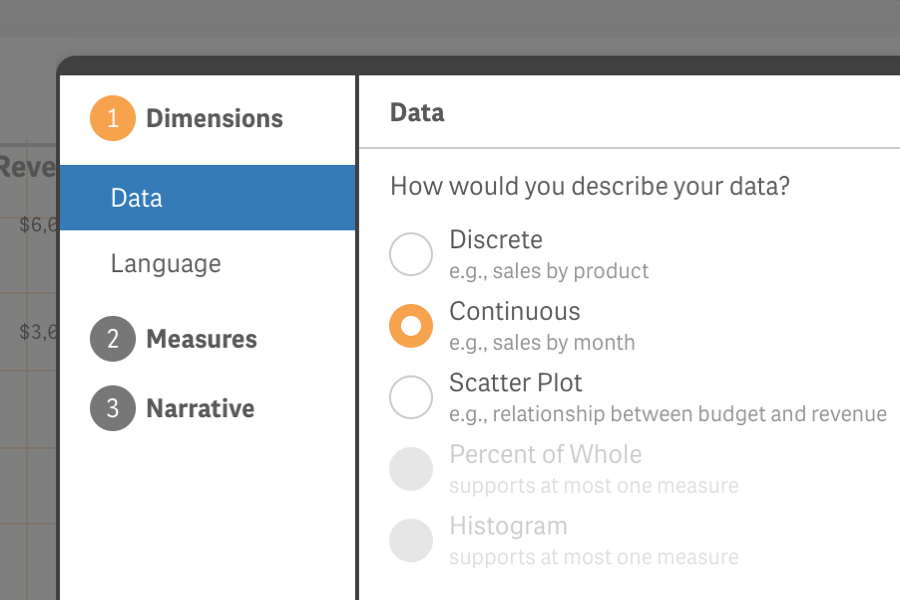
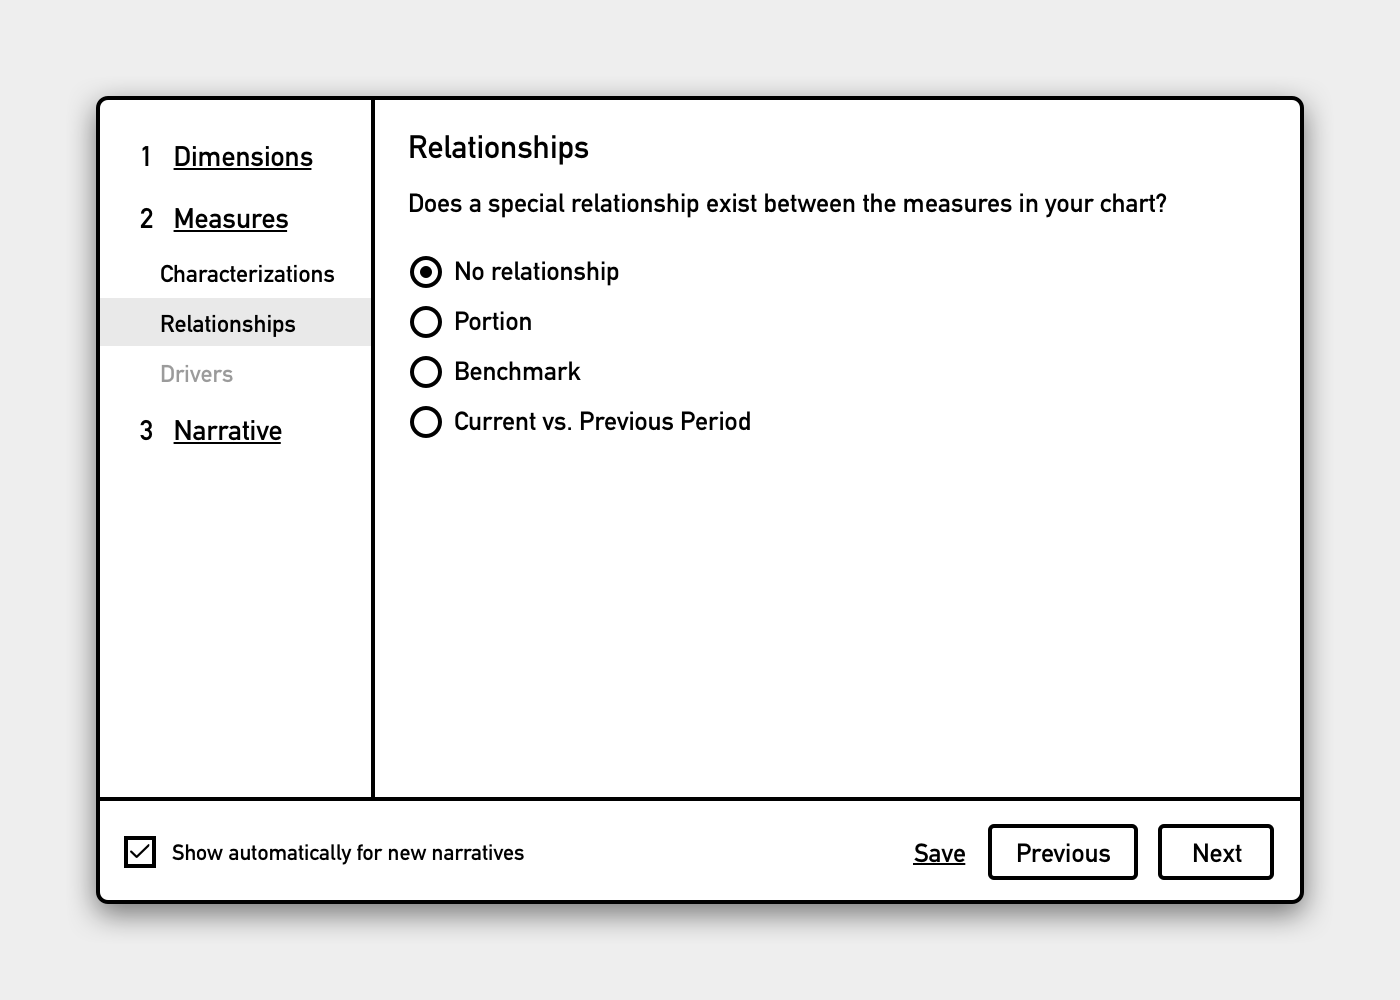
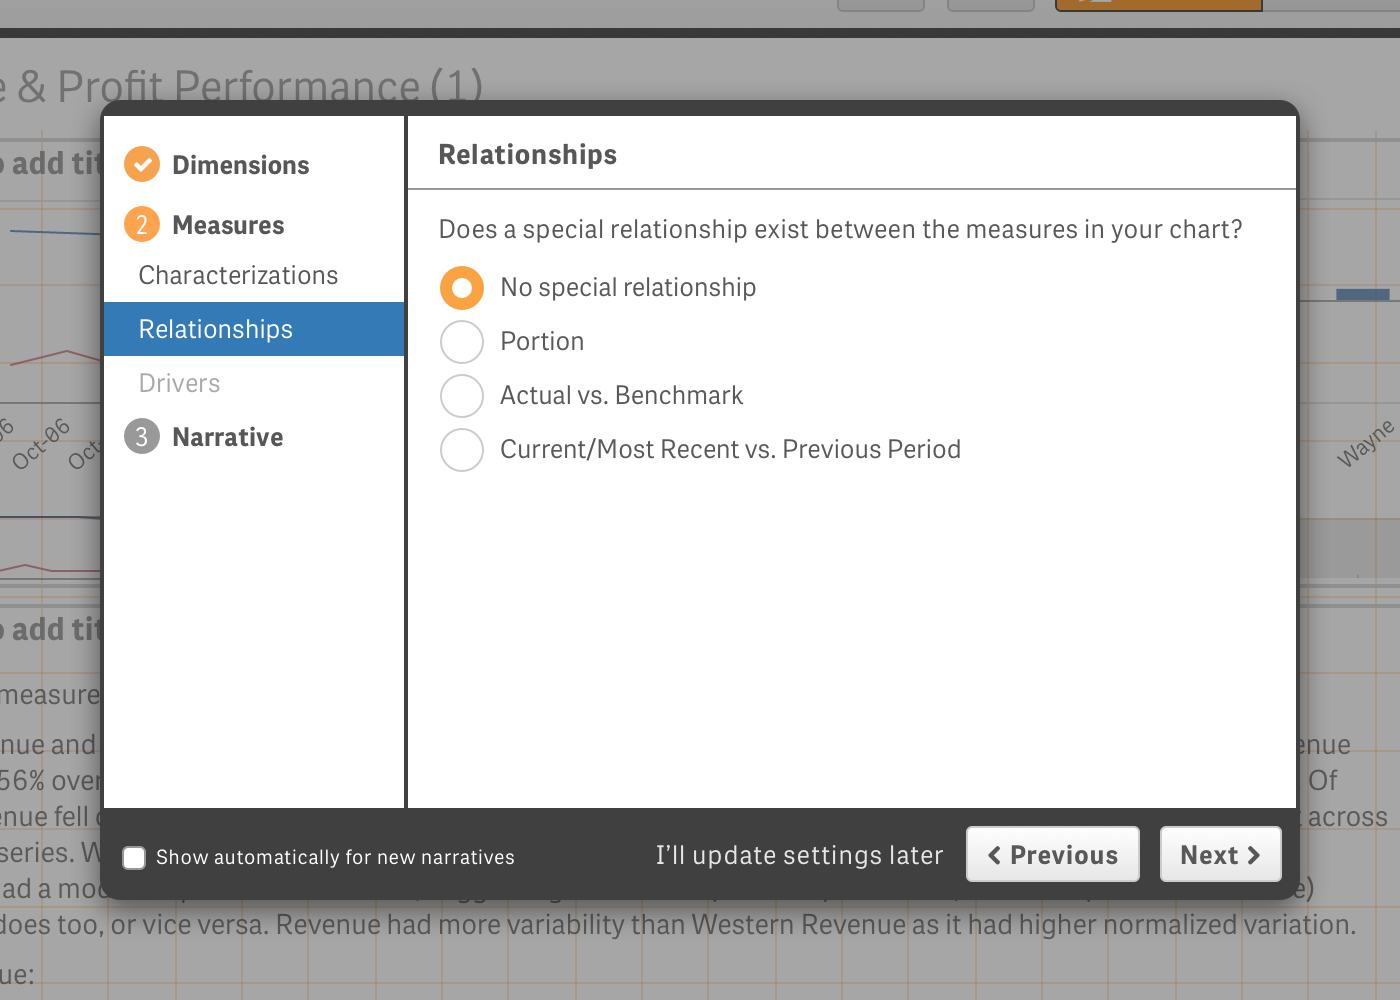
Using these three categories, I came up with several iterations of potential layouts and user flows. Because of the linear nature of the configuration items, I was drawn to a dynamic wizard layout which would walk the user through each necessary step while hiding anything that was irrelevant down the line.
Testing
I set up several user tests with internal employees as well as active users to gather feedback on this approach. By comparing our current layout to the new wizard, I determined that user understanding of the configuration items in the wizard format was noticeably higher. This resulted in narratives with more natural sounding language and improved readability.
Using an iterative testing approach, I made adjustments to the wireframes after each testing session. User feedback allowed me to fine-tune the configuration item categories and ensured that each was laid out in an understandable manner. The end result was a natural flow through the wizard with the added affordance of quick navigation for advanced users.
Mockups
Because our extension existed as a component of a larger piece of software, I strove to match the look and feel of Qlik Sense in order to increase user trust and understanding. Using Sketch, I mocked up how each narrative extension would be initialized, configured, and ultimately consumed by the end user.
Outcome
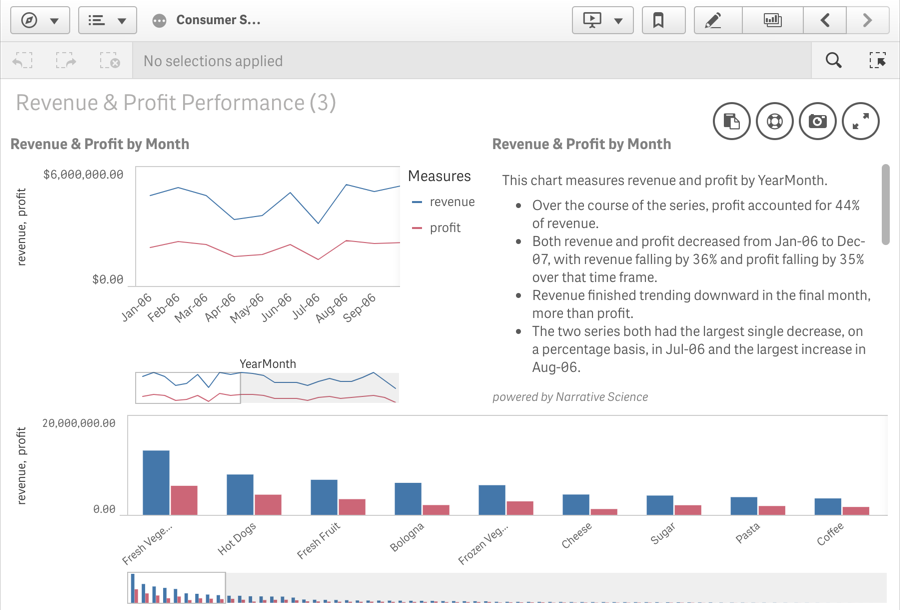
Building upon the existing extension framework, I created an automatic, opt-out settings modal using AngularJS. Mimicking the functionality found in native Qlik Sense visualizations, the end result was an extension which felt native, familiar, and simple to use.
A month after launch, we consulted our Mixpanel data and found an increase in overall engagement with the narrative settings of 127%. Users were not only finding the settings, but using them as intended to actively improve their narratives.
Because of the success of the product and subsequent UX overhaul we were able to expand our learnings to several other BI platforms. Moving forward I led both the design and development of two additional BI extensions: Narratives for Tableau and Narratives for Lumira.